I was working for Greenpeace during the first few years of the Fukushima meltdowns, and as a communications person it was always complicated to demonstrate the impact of radiation in the environment.
Talking about numbers of chest x-rays, dose rates on international flights, potassium in bananas etc. are some ways to discuss the kinds of exposure people can face, but they’re abstract ways of communicating about something that is invisible. Likewise impact photos typically focus on portraits of victims, photos of abandoned/overgrown places, or shots of numbers on scientific equipment (which at best are largely meaningless to most people, and at worst encourage unhelpfully fearful responses).
So to try and solve this problem I adapted an idea from the Immaterials wifi visualization project, and developed a new method of making environmental radiation visible with light painting. I then used it to map populated (or soon to be populated again) areas of Fukushima and Chernobyl-impacted Russia, in time for the 5th and 30th anniversaries of the meltdowns.
The light kit is composed of three main pieces:
- A two-section piece of aluminium channel holding 64 high power RGB LEDs
- A Thermo Scientific Mini Monitor and probe (Geiger counter)
- An Arduino controller
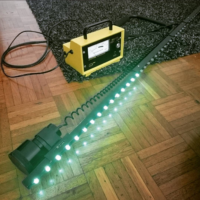 Measurements are taken with the Mini Monitor, which outputs an analogue Counts Per Second (CPS) signal the Arduino then converts to a digital one for the LEDs. Pretty simple idea really: the greater the radiation reading, the more LEDs light up.
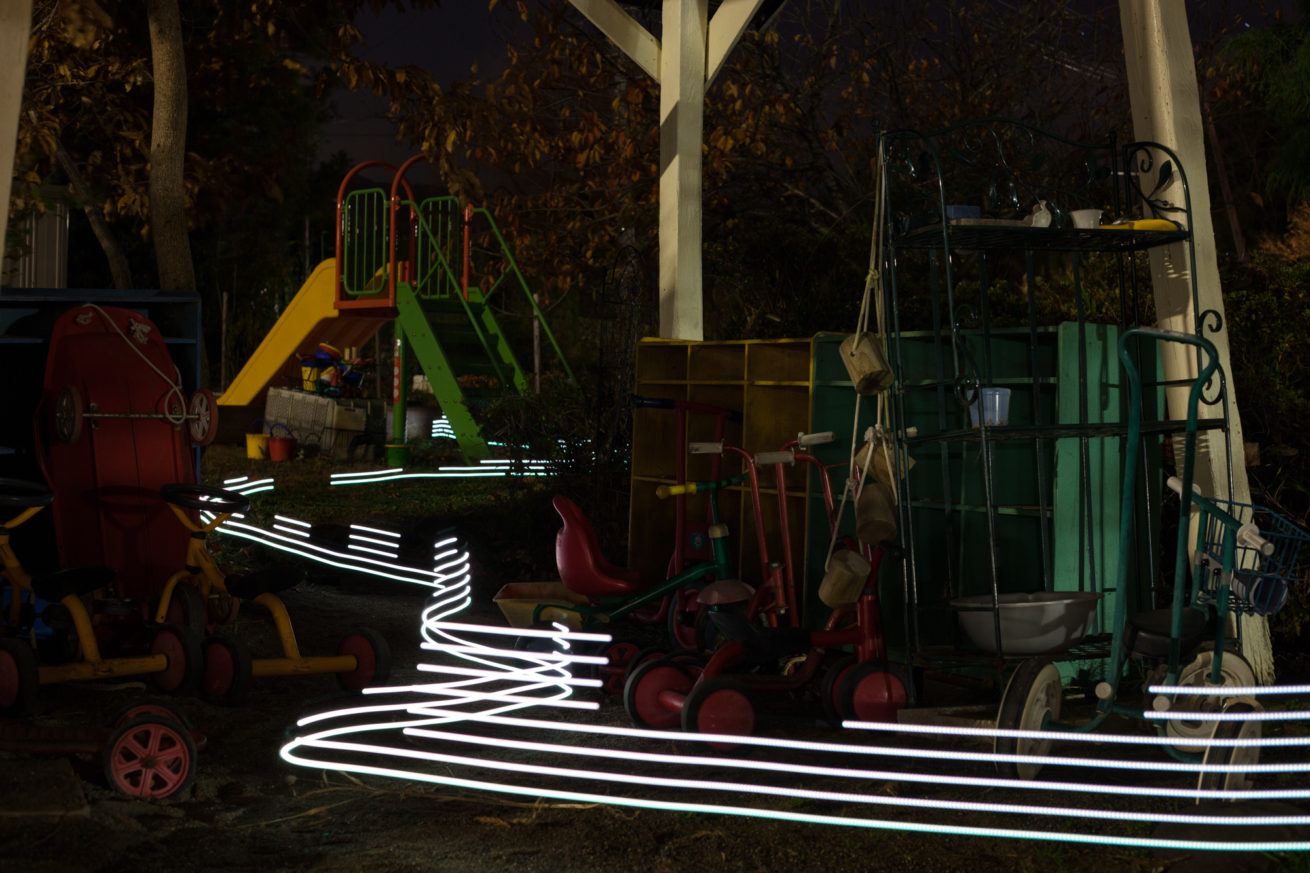
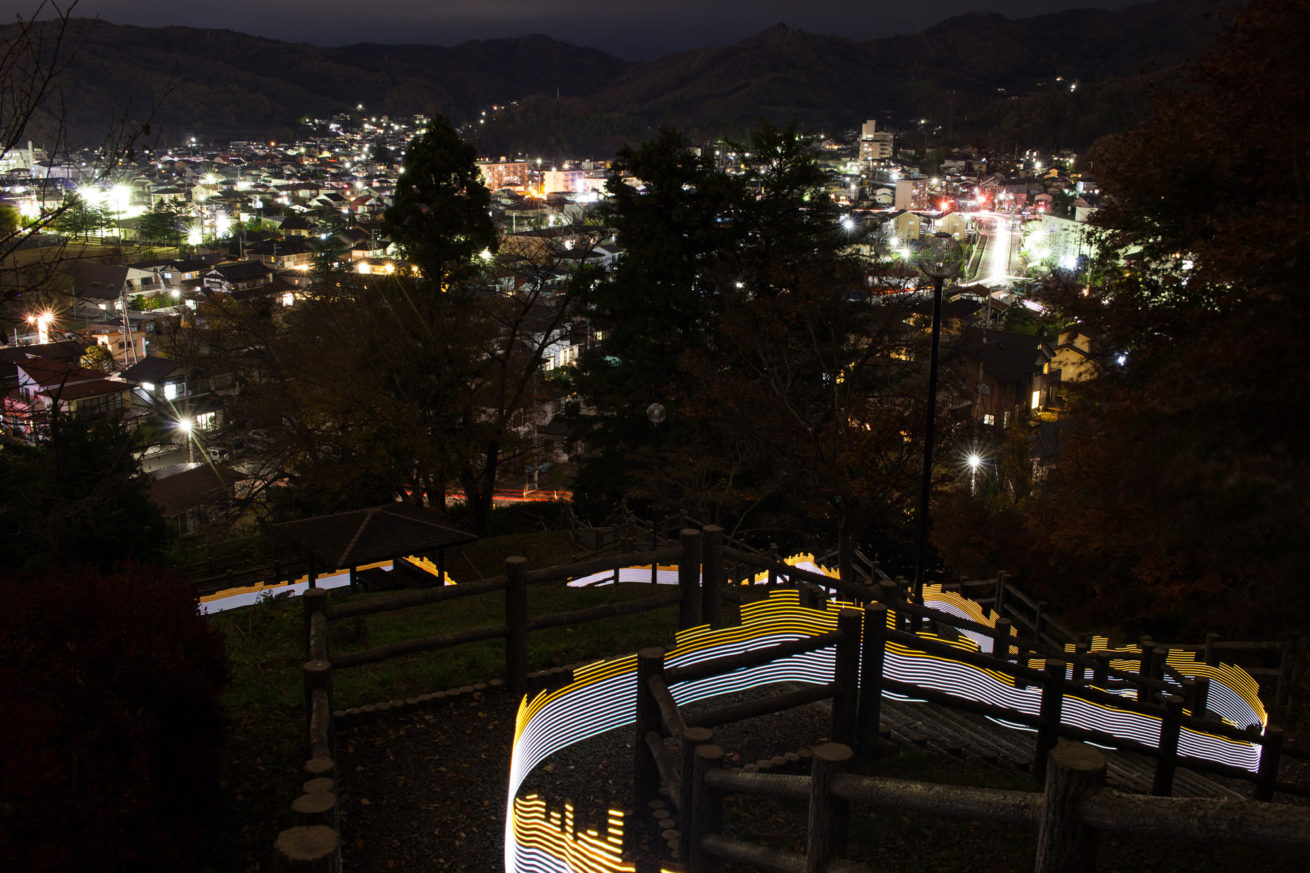
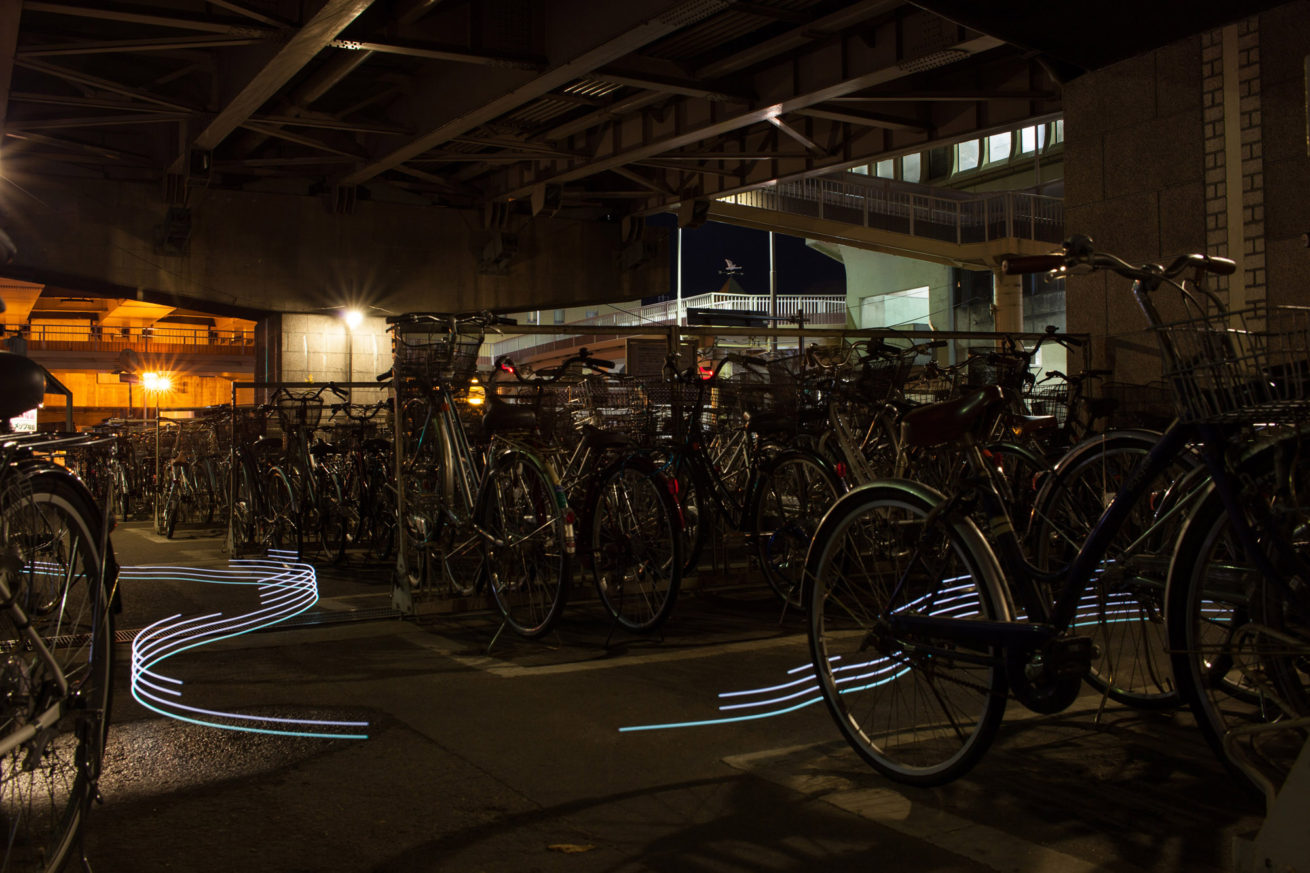
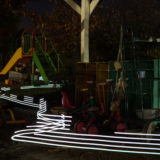
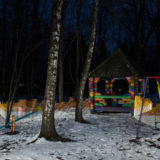
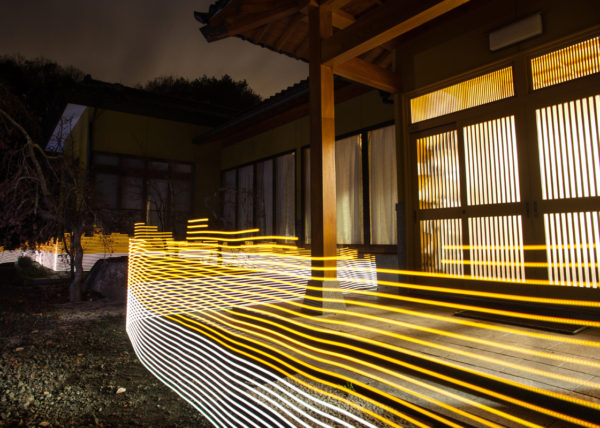
With LEDs lighting up dynamically in response to radiation levels in an environment, we can then create images showing where it is with long exposure photography. Leaving the shutter open for ten seconds to five minutes or longer and walking through the frame creates undulating lines of light, highlighting radiation.
To give some more meaning to these “light maps”, we decided to implement a colour scale that would give the levels some context in both Fukushima and Chernobyl-impacted areas.
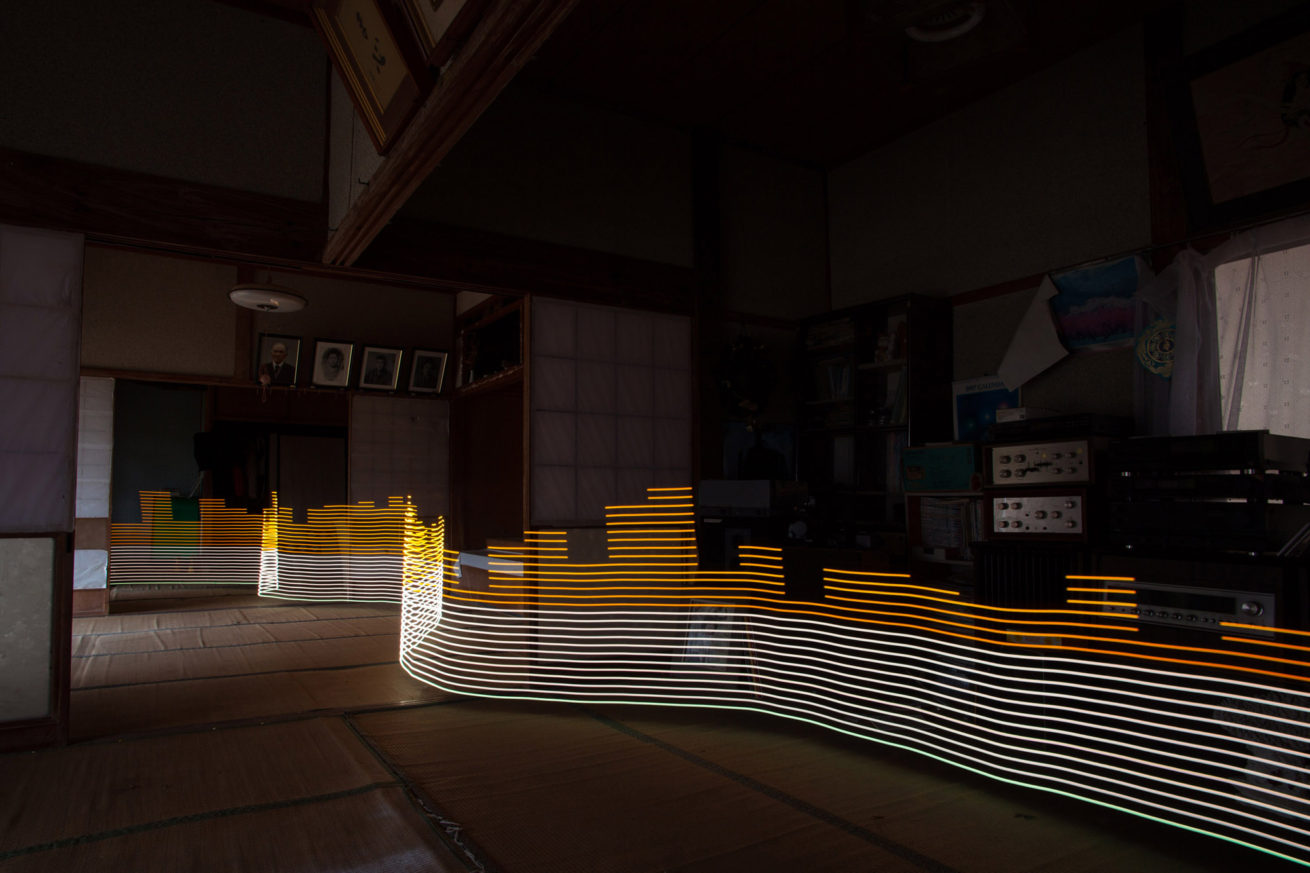
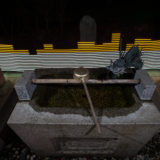
We settled on a White/Orange/Red scale of 0.23uSv/h, under 1.0uSv/h, and greater than 1.0uSv/h, and for each photo we took measurements with secondary devices - such as the sensitive Thermo Scientific RadEye - at one metre height. This way we could double check the low and high radiation levels against the number of lights showing on the stick, and ensure it gave an accurate representation of what was there.
Less than 1mSv/y is an internationally accepted level for radiation exposure when it comes to the general public, and Japan’s decontamination guide of 0.23uSv/h tries to respect this (with the assumption that an average person will spend eight hours outside per day, and 16 hours inside, presumably having lower radiation levels). This is practically the same as Russia’s official “norm” of 0.20uSv/h following the Chernobyl disaster.
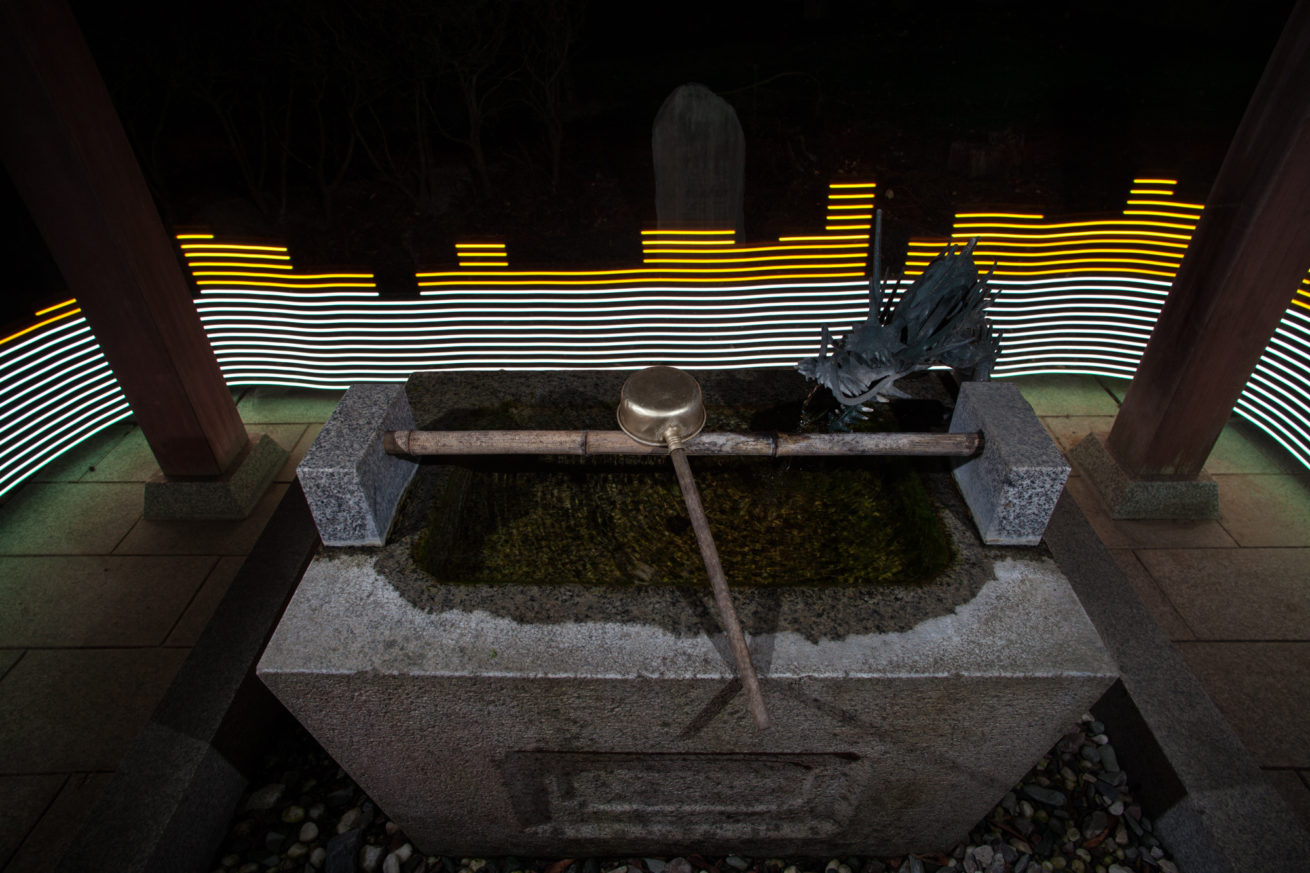
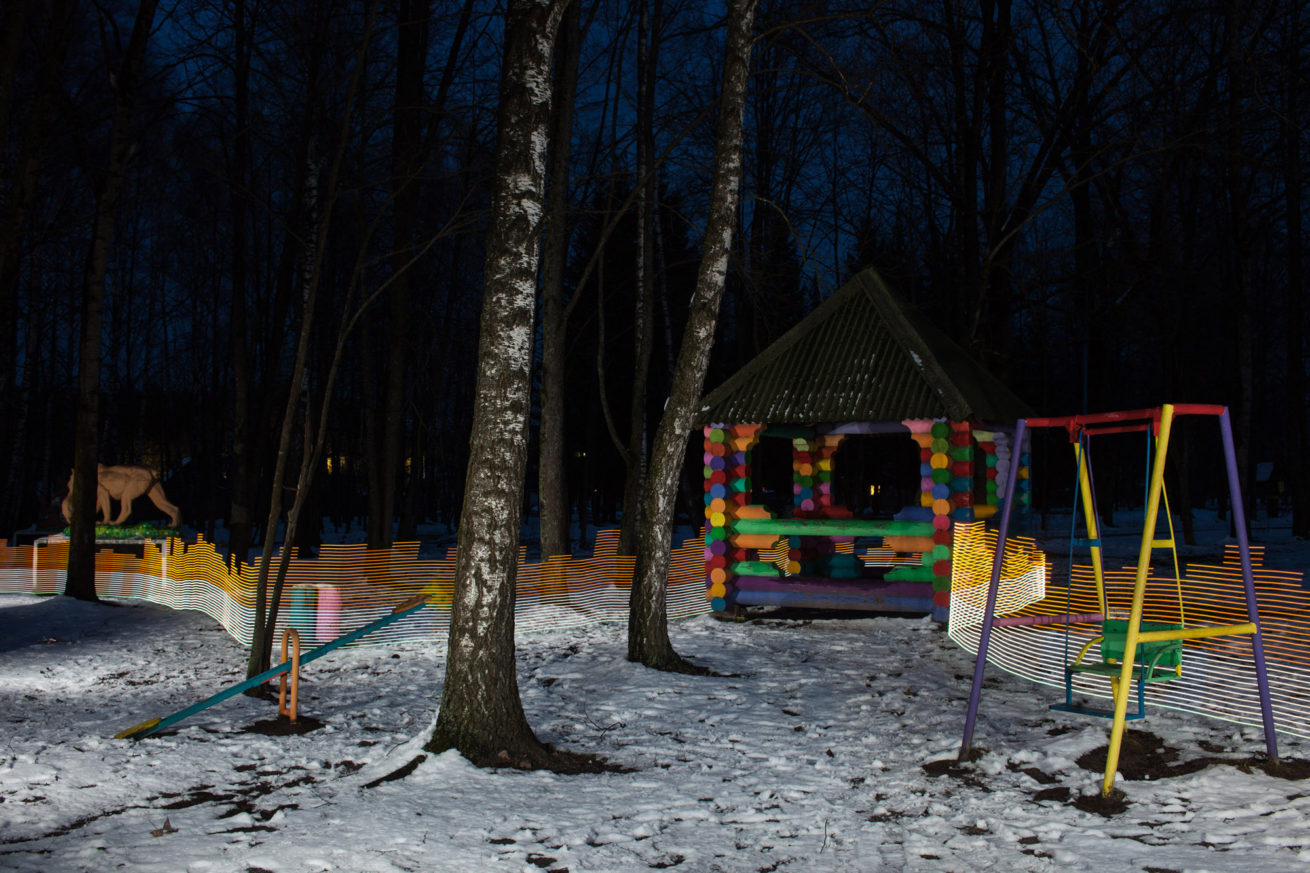
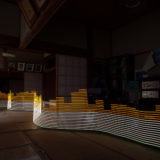
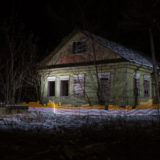
Orange shows contamination levels elevated above international standards for the general public, and up to 1.0uSv per hour (roughly 5mSv per year). This is a range where protective measures to minimise radiation exposure (such as resettlement, decontamination, special health services, food controls, etc) should be considered.
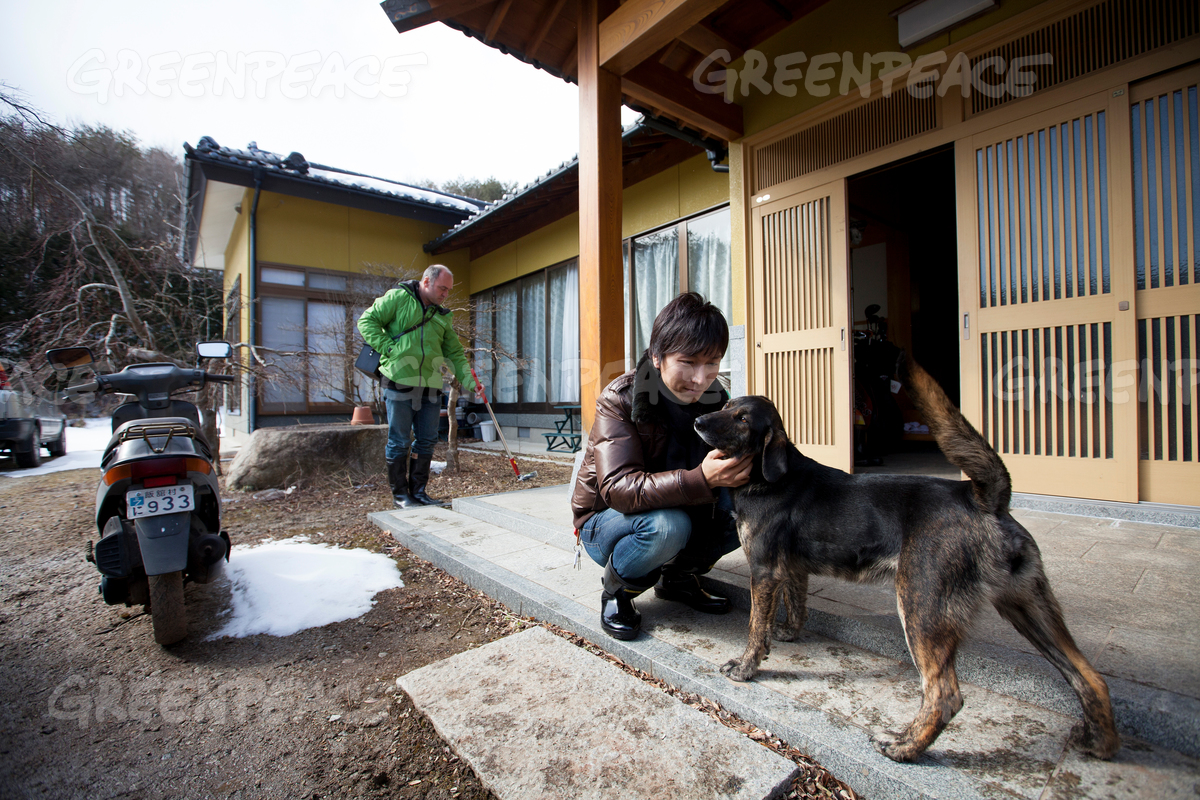
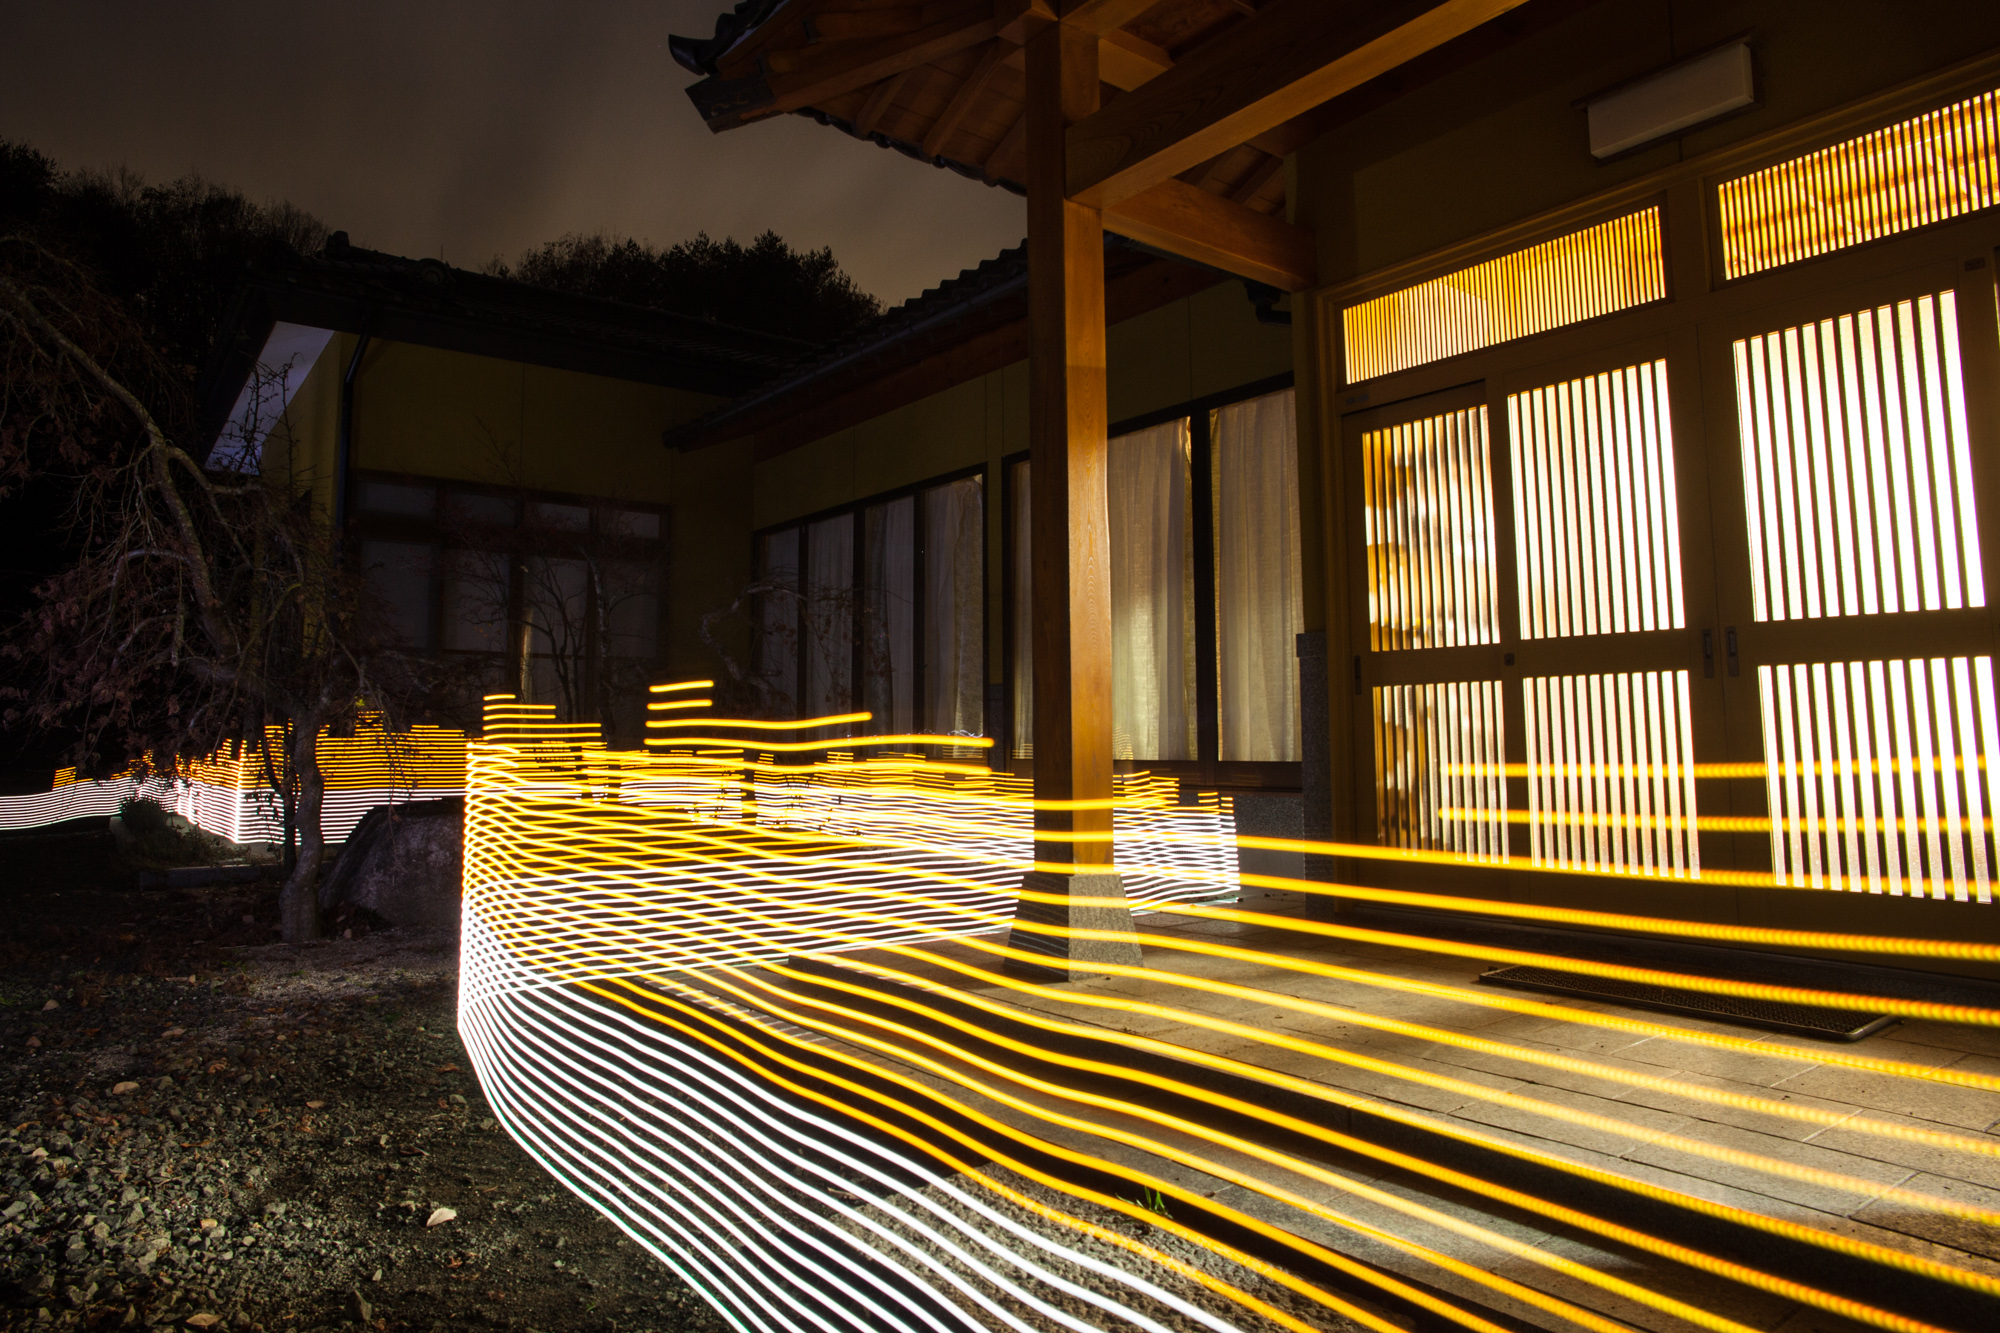
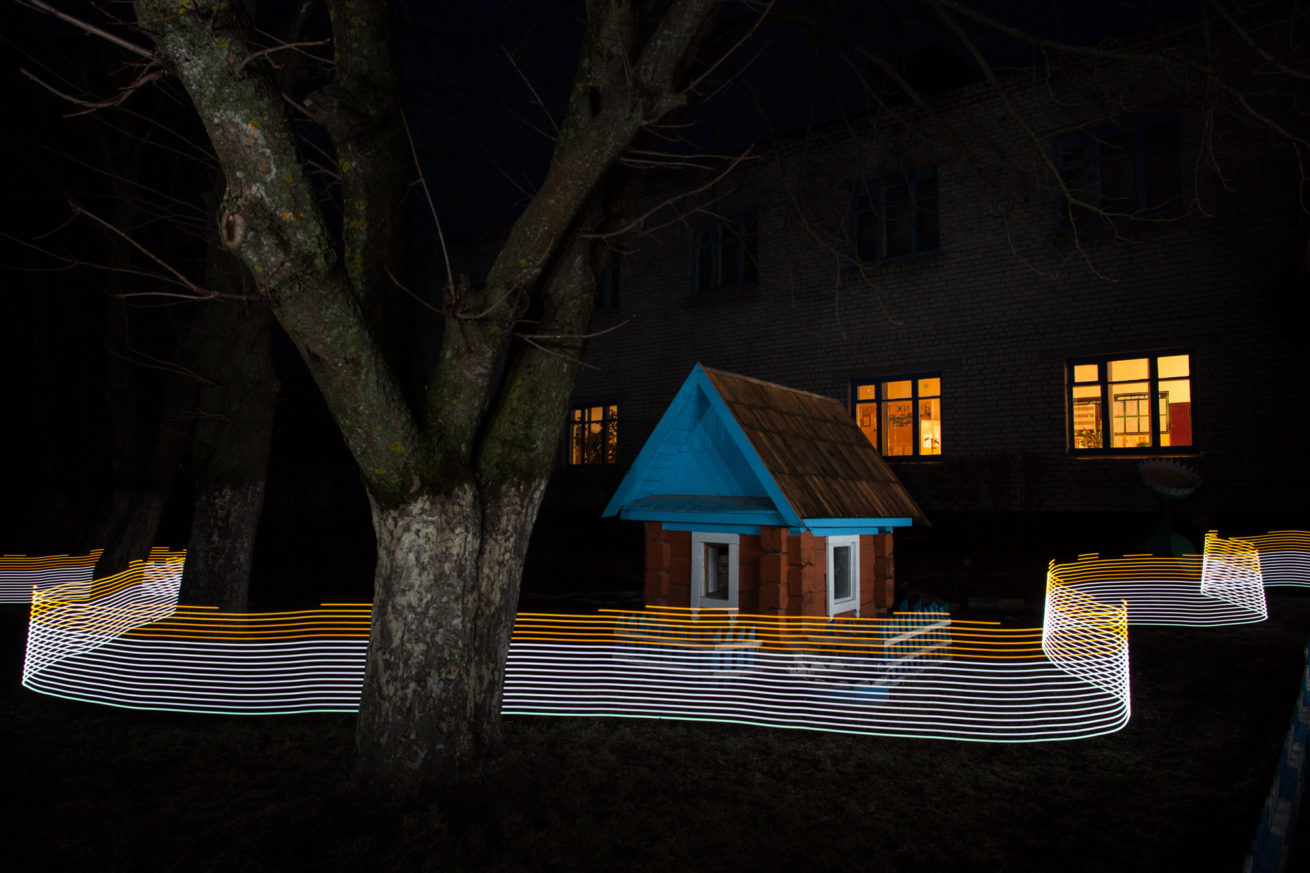
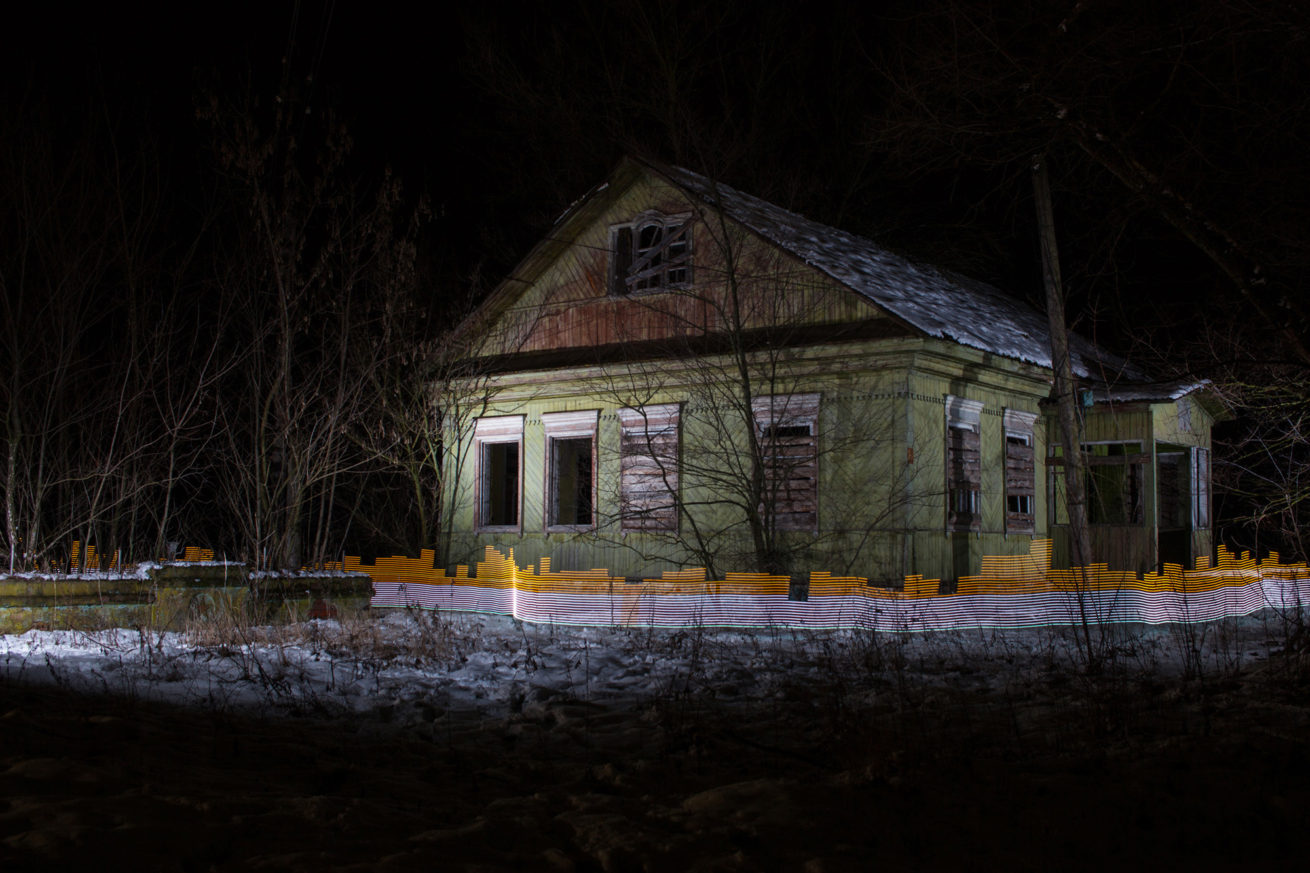
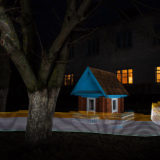
The above rollover image shows Kenta Sato's family home, surrounded by a wall of orange light indicating radiation levels are consistently above international limits. The house and land has been decontaminated, but as it is surrounded by forest that has not been decontaminated, recontamination is inevitable. The forest is only 50 metres away, and the levels there are consistently in the red.
Red shows radioactivity greater than 1.0uSv per hour (upwards of 5mSv per year) – a level where protective measures to minimise radiation exposure are necessary. Levels greater than 5mSv per year coincide with Russia’s criteria for the "Obligatory Resettlement Zone" around Chernobyl (page 32).
What this tool shows, is that radioactive contamination stubbornly lingers in the environment, and despite decontamination work and many years and decades passing since Fukushima and Chernobyl, the populations of each continue to live with radiation levels above international standards; and in areas where resettlement should have happened a long time ago.
Fukushima gallery here.
Chernobyl-impacted Russia gallery here.